In recent years, due to the increase of driving torque, the increase of conveyor belt speed and the use of ceramic hysteresis, the performance of pulley lagging has become more and more important. The popularity of ceramic backplanes is due to the reduction of the risk of slippage of the drive pulley and the reduction of the wear of the backplane.
However, the application of ceramic hysteresis on the pulleys can cause hysteresis failure, which is costly to wear and tear on the belt; the most expensive component on the conveyor belt. Modern analysis and simulation tools, as well as a better understanding of how hysteresis and belts interact during torque transmission, are necessary for modern conveyor designers to choose this relatively inexpensive but important component. Case studies and analysis techniques will be demonstrated.
1. Introduce
There are several basic reasons for applying hysteresis on driven and non-driven pulleys.
- Hysteresis acts as a protective layer to prevent premature failure of the pulley due to wear.
- While protecting the pulley, it can also protect the conveyor belt from similar wear failure.
- Lag will also increase the friction between the pulley and the belt, which usually requires torque to be transmitted to the belt through the pulley.
Hysteresis is applied to almost all conveyors to address at least one (if not all) of the basic points. In addition to performing the above points, hysteresis should be applied in a way that the hysteresis itself will not wear prematurely because of wear, or delamination from the pulley, as well as causing belt wear.
Now, applying hysteresis on conveyors with low belt tension and the low drive torque is, in many ways, simpler than applying hysteresis correctly on conveyors with high belt tension and high drive torque. The hysteresis applied to small conveyors is often selected based on economic selection criteria, and then evaluated based on whether a failure has occurred.
Due to the low tension and torque (the hysteresis is relatively thick), failures are not common, and the hysteresis is effective. However, in many applications today, the drive torque and belt tension are getting higher and higher. If you do not consider the risk of a major failure of expensive high-torque/high-tension conveyor components, you cannot safely select hysteresis based on economic selection criteria alone.
In general, when slipping, the hysteresis wear rate (similarly, the wear rate of the belt bottom cover) is proportional to the contact pressure between the belt and the pulley surface (Metlikovic (1996)). In other words, higher torque and higher tension increase the risk of pulley lagging and wear of the bottom belt cover. This is especially true for ceramic linings. This article will discuss how to analyze the impact of hysteresis design on the three basic reasons why hysteresis is applied to high-torque conveyors, as well as the impact of hysteresis design on the relative life expectancy of hysteresis. Discuss analysis methods and give examples to illustrate the application of analysis methods. It is worth noting that this is a state development paper.
2. Failure and Why
Before discussing analytical methods, it is important to understand what the ultimate goal of these analyses might be. The purpose of this article is to understand through analysis:
- Premature failure of rubber and ceramic backing plates due to wear and/or peeling of pulleys.
- Potential lag causing damage to other conveying components (especially the belt of the bottom cover).
The two determinants of whether the high torque application of the pulley lagging will cause any of the above are “local slip” (which causes wear) and excessive internal stress/strain within the hysteresis, which may cause delamination of the pulley lagging. Metlikovic (1996) pointed out that “nearly 75% of failed pulleys failed due to wear”, and further pointed out that “wear failure is a complex problem that cannot be solved only by improving the wear resistance of hysteresis materials.”
How to predict wear and calculate internal stress and strain? The understanding of wear tells us that wear occurs when materials rub and slide against each other; therefore, if we can predict that any friction or slip occurs between the belt and the hysteresis, We can predict where wear is likely to occur and then adjust our design to reduce the predicted slip. In predicting internal stress, modern finite element analysis is a useful tool that can accurately predict the magnitude of stress/strain in a hysteresis model.
It is not fully understood that the upper limit of the allowable internal stress or strain of the lagging mechanical failure before the occurrence of the lagging mechanical failure, and how much local slippage accelerates the wear of the belt cover and/or the pulley lagging. However, we know from experience that if a local slip or high stress/strain is not resolved, there will be a significant risk of acceleration lag or failure of the belt cover, especially in high torque applications.
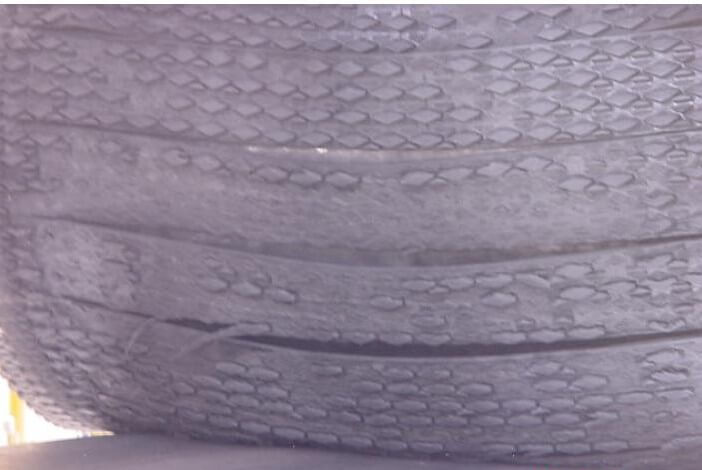
Figure 1-A picture of the hysteresis failure application, showing hysteresis wear and delamination.
3. Local sliding prediction
A method of lagging design and analysis to predict whether wear leads to “localization” may occur in a backward application.
Pulley torque is transmitted to the conveyor belt by the circumferential shear force between the conveyor belt and the conveyor belt. Classical equations show that the maximum allowable torque and tension transmission is related to the tension on the slack side, the limit friction factor between the surface of the coil and the pulley and the surface of the belt. Although this equation is generally valid, it is basically wrong.
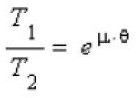
Equation 1
An alternative calculation was developed that included belt and hysteresis stiffness to predict the maximum allowable tension transfer.
Experience tells us that continuous sliding will cause wear and most successful installations rarely show rubber wear. The successful history of Euler’s equation (eq 1) can be explained by observing that the design value of CEMA (2005) for ceramic hysteresis is much lower than the actual value measured by direct test (0.6 to >1).
When the conveyor belt moves around the drive wheel, the tension of the conveyor belt is reduced, causing the conveyor belt to shrink. In order to prevent slippage, the hysteresis member must be deformed circumferentially to match the belt contraction. The traction of the belt causes this hysteresis deformation, but if the limit friction is exceeded, slippage will be allowed.
When the belt contracts, if the local friction between the hysteresis and the belt is not sufficient to maintain the shear stress that tightens the hysteresis, it may slip on the pulley. Any form of the slippage will cause component wear. The maximum friction force that may exist between the ceramic backing plate and the tape rubber is significantly higher than the friction force between the rubber backing plate and the tape rubber due to mechanical penetration.
The mechanical locking of the sharp ceramic bumps embedded in the rubber can cause tearing and, if used improperly, can cause serious wear of the belt. Proper analysis of the problem using the alternative model described in this article can solve these slippage problems.
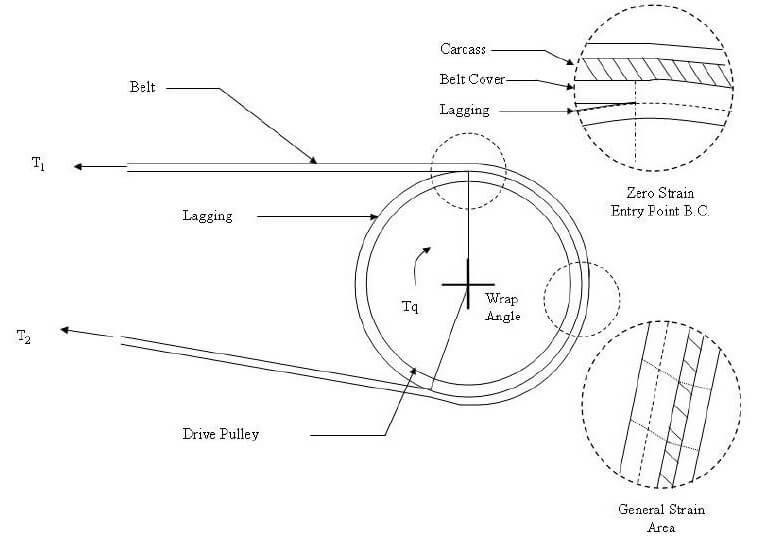
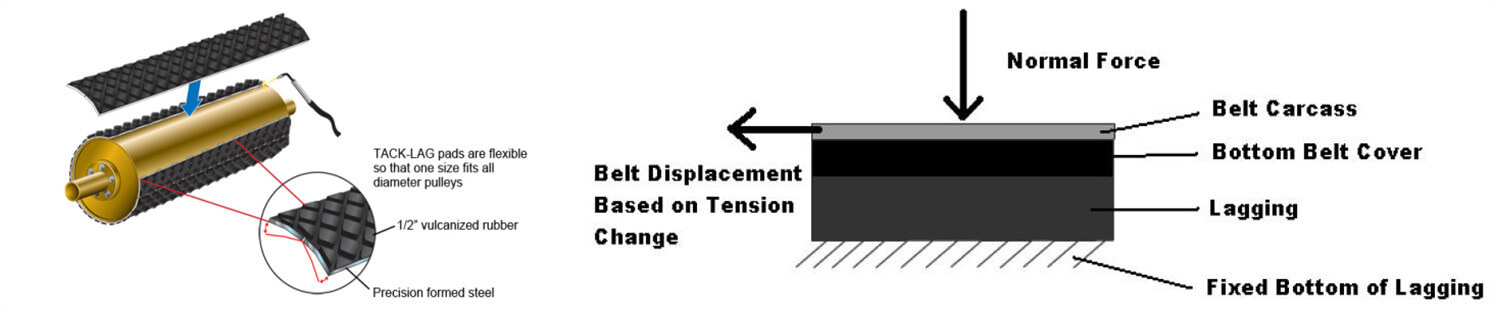
Figure 2-A graph showing the physical geometry of the body hysteresis and how the strain changes as the belt moves on the pulley.
The belt in contact with the hysteresis must be divided into even parts so that the force balance can be calculated numerically. The nodes define the beginning and end of each segment, and the segment itself is modelled as a spring, and the spring constant is derived from the rubber hysteresis and the movement shear resistance of the rubber band cover. The hysteresis spring is connected from the node to the fixture (simulating the pulley surface), and the node is connected with each other with a spring. See the picture below
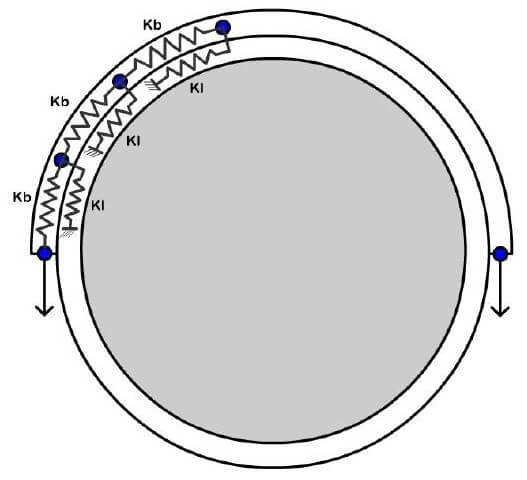
Figure 3-Graphical representation of the finite element model used in the improved slip prediction method.
Improved analytical techniques work so that the pulley is at the same speed as the belt at the bite point and maintains a constant circumference due to the high rim stiffness. As the belt shortens as the tension decreases, it is the slower and shorter pulley contact arc, where it leaves the belt.
Therefore, we can establish an independent path length equation related to each model element based on the above-defined belt and hysteresis stiffness, belt tension and hysteresis shear force. Using matrix solutions to solve these equations at the same time, the tensions of the band and the hysteresis section are obtained. From here, the hysteresis shear force can also be calculated.
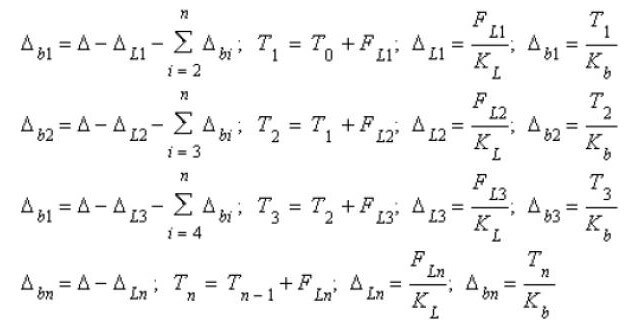
Figure 4-Shear force and deformation calculation. Where n is the total number of bands. Ti is the tension force of each tape section i, FL is the hysteresis shear force, Δb is the change in length of the tape section, ΔL is the hysteresis deformation, and Δ is the total deformation.
4. Deformed
Improved alternative analysis techniques to numerically calculate belt shrinkage and required hysteresis deformation and related tension distribution assuming no-slip conditions exist. Then, the required friction coefficient between the tape and the hysteresis is calculated based on the tension gradient and the local tension.
A comparison between the belt and hysteresis between the required coefficient of friction and the actual coefficient of friction to determine the local belt may slip, and make design changes if necessary to prevent slipping. This calculation method is valid for ceramic hysteresis and rubber hysteresis under different limit friction values.
When rubber slides on another surface, it will produce dynamic deformation, usually accompanied by a stick-slip cycle. Due to the viscoelasticity of rubber, dynamic deformation will dissipate energy. Under high-speed and high-load sliding, these deformations are large enough to overcome the strength of the material and cause material loss through wear.
If the interface material is very rough, hard, and sharp, the deformation is more serious, commensurate with the higher friction effect. In fact, friction may only be limited by rubber or bond strength, so if friction is overcome, even localized, the cost is heavy wear. In particular, the adhesion between rubber and ceramic blocks has proven to be a design challenge.
The smooth ceramics with low friction and rubber deformation will not produce the roughness or nest style of high friction and severe surface deformation. The belt cover is less worn, especially in the presence of a lubricant. This may be a good solution, it is recommended that the pulley does not rely on friction, such as driving, braking or tracking purposes. Hard hysteresis materials with intermediate roughness have intermediate effects on friction and wear.
5. Dimensional strain/stress prediction
The models were further tested using a commercially available finite element program. These models were analyzed using the improved slip prediction model described in the “Local Slip Prediction” section of this article. The finite element model assumes linearity, elasticity and material properties, and simulates the contact between the tape and the hysteresis body under a certain limit friction factor. The method described here has the following steps:
- Build a model so that the length of the rubber (or ceramic) lagging is equivalent to the circumferential length of contact with the belt around the pulley being flattened.
- Lay a belt with the same length as the belt contact arc on the top of the hysteresis layer, with a bottom cover and a carcass.
- Using the belt tension calculated by the local slip prediction method, the normal force perpendicular to the surface of the pulley can be calculated by the tension change at a single node, and the normal component of the applied tension is calculated using the trigonometric function (see the figure below) ).
- These normal forces are calculated through the entire contact arc and then applied to the flat belt carcass to simulate the normal force felt by the curved belt around the pulley.
- Then, given the known effective tension (T1-T2) passing through the pulley surface and the known elastic modulus of the belt, we know how much the belt will stretch or contract from its natural tension state through the contact arc. This length change is applied to the model, and a contact algorithm is used to simulate the expected friction factor between the belt cover and the back cover. During the analysis, the bottom of the hysteresis is fixed from the movement.
Meshing and running the model in the finite element program gave the results of simulating the improved local slip prediction method described above, with some three-dimensional effects added. These three-dimensional effects are used to compare the stress and strain at the bottom of the hysteresis and the stress and strain seen at the arc of contact between the band and the hysteresis, which provides valuable insights into what might cause delamination risk.
Then we can change the hysteresis geometry in the model (for example, add grooves or change the rubber thickness), and see the effect of the results on stress and strain. Reducing stress and strain significantly reduces the risk of delamination. The model can also be used to estimate how geometric changes may affect the amount of slip seen in hysteretic applications.
6. Case Study
Use an improved local sliding prediction model:
The following table summarizes the 3 different studies and their results entered in the improved local sliding prediction model.
Table 1-Summary of case studies mentioned in this report
| Case Studies For Lagging Analyst | |||
| INPUTS: | |||
| Case Name | Initial Study | 1st Alteration | 2nd Alteration |
| Belt Width (in): | 60 | 60 | 60 |
| Belt Elastic Modulus (PIW): | 1439000 | 1439000 | 1439000 |
| Belt Bottom Cover Thickness (in): | 0.25 | 0.25 | 0.25 |
| Lagging Thickness (in): | 1 | 0.55 | 1 |
| Pulley Diameter (in): | 48 | 48 | 48 |
| Wrap Angle: | 210 | 210 | 210 |
| T1 (lbf): | 177555 | 177555 | 187555 |
| T2 (lbf): | 48321 | 48321 | 58321 |
| Te (lbf): | 129234 | 129234 | 129234 |
| Slip Friction: | 0.7 | 0.7 | 0.7 |
| Rubber Durometer Sh A: | 70 | 70 | 70 |
| Base Deflection Toggle: | 0.076 | 0.044 | 0.073 |
| OUTPUTS: | |||
| Lagging Elastic Modulus (psi): | 1001.84 | 1001.84 | 1001.84 |
| Lagging Shear Modulus (psi): | 333.95 | 333.95 | 333.95 |
| Degrees of Slip Free Contact: | 186 | 180 | 199 |
| Degrees of Slip: | 24 | 31 | 11 |
| Initial Lagging Shear Strain (in/in): | 0.076 | 0.044 | 0.073 |
| Maximum Lagging Shear Strain (in/in): | 0.09706 | 0.10512 | 0.099 |
The case named “initial study” contains the initial input to the model. Most inputs should be self-explanatory, except for the rubber hardness tester Sh A, and the basic deflection switch. The rubber hardness tester is used to measure the hardness of the rubber used in the model. From the rubber hardness tester, the elasticity and shear modulus of the rubber can be estimated, and then the hysteresis and the spring constant of the model can be characterized.
The basic deflection switch is the amount of initial strain (or pre-strain) that needs to be added to the model in order to satisfy the condition that the integral of the shear stress distribution should be equal to the tension distribution on the pulley (Metlikovic (1996)).
This preliminary study showed that a high-torque drive pulley lagging with a diameter of 48 inches produces an effective tension distribution of 129,234 lbf over a belt length of 210 degrees in contact with the pulley. The total thickness of all rubber from the pulley surface to the belt body is 1.25 inches (1 inch is the hysteresis, 0.25 is the belt bottom cover).
For this analysis, the maximum friction coefficient is 0.7 used to describe the hysteresis and the contact between the belt. This friction coefficient and friction coefficient are used in Euler’s equation (Equation 1). The model considers that the friction coefficient of 0.7 is the maximum effective friction required to prevent slipping instead of using the friction coefficient in the entire contact arc with the Euler constant.
The analytical results of this preliminary study showed that the hysteresis between the last 24 degrees of contact and the belt cover suffered local slippage (where the friction factor used is a full 0.7), which may cause the hysteresis and wear of the belt cover. The figure below shows how the model predicts the shear strain distribution of the contact arc of the hysteresis surface.
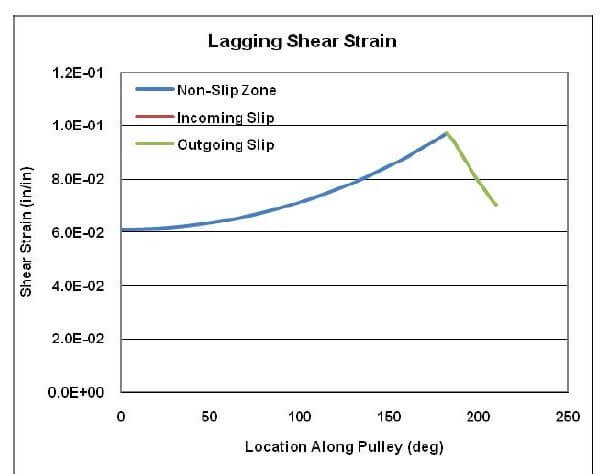
Figure 5-Shear strain and position along the pulley surface.
It can be seen from the figure that the shear strain gradually increases from the contact with the tape and hysteresis until the hysteresis and the belt cover begin to slip. At this time, the shear strain reaches the maximum value. In the last 24 degrees of contact, the shear strain gradually dissipates as the hysteresis and the belt coverslip with each other. It is *0.097 (in/in) for maximum shear strain. Generally speaking, the higher the strain value, the higher the risk of wear.
The initial research made two basic modifications, creating research called “first modification” and “second modification”. In the study of the first change, we reduced the thickness of the backplate from 1 inch to 0.55 inches to see the effect on the model. In the study of the 2nd change, the overall tension of the conveyor belt was increased by 10,000 lbf (while maintaining the same effective tension on the conveyor belt) to observe the impact on the model (this simulated something similar to increasing the tension on the conveyor belt system to solve slippage shift).
The results of the first alteration study showed that the reduction of hysteresis thickness increased the amount of local slip from the last 24 degrees of contact to the last 31 degrees of contact. The maximum shear strain increased from 0.097 to 0.105 (in/in). A study of the details of the analysis showed that the reduction in hysteresis thickness resulted in a significant increase in the stiffness of the spring constant used in the model. Basically, the hysteresis is too stiff to adjust its position to maintain contact with the belt because the belt shrinks as it moves around the pulley, the available normal force and friction, in this case. It can be concluded that reducing the hysteresis thickness increases the risk of local slippage.
The results of the second alteration study showed that the increase in overall tension reduced the amount of local slip from the last 24 degrees of contact to the last 11 degrees of contact. The maximum shear strain remains at 0.099 (in/in) basically unchanged. Increasing conveyor belt tension seems to be an effective way to solve the problem of slippage, but it may adversely affect other components in the conveyor system, including the conveyor belt.
7. Use 3D finite element analysis
The usefulness of the 3D finite element program analysis hysteresis application is the ability to change the physical geometry of the hysteresis and visualize the results. This paper studies the effects of using a non-groove rubber hysteresis agent, using a grooved rubber hysteresis agent and ceramic hysteresis agent.
For this analysis, all hysteresis thicknesses are set to 5/8″ thick and subject to the same effective tension change (and the resulting belt contraction/displacement). The hysteresis is flattened and the method is applied to the belt at the top of the hysteresis Directional force (see Figure 6), which is calculated by the improved slip prediction method described in this article. The backplate with grooves is equivalent to 1 “x 1” x 0.25 “rubber pads on the backplate, total The thickness is 5/8″. Similarly, adding a tiled backing plate is equivalent to adding 1″x1″x0.25″ tiles to the backing plate for a total thickness of 5/8”. The friction of the sliding model between all surfaces The coefficient is 0.7. There are “nodes” on the tiles that allow them to penetrate the rubber tape cover, mechanically increasing the coefficient of friction by 0.7.
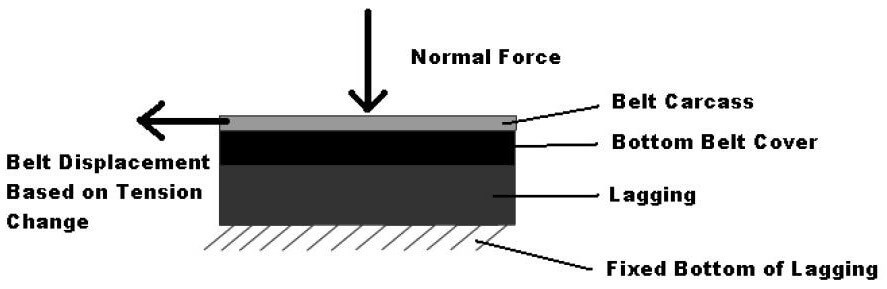
Figure 6-Schematic diagram of general finite element model geometry
The results provided by the finite element model show slip and the resulting strain hysteresis across thickness and with cover. Figure 7 below is a graph showing the displacement of the bottom cover and the displacement of the non-groove hysteresis top across the contact arc.
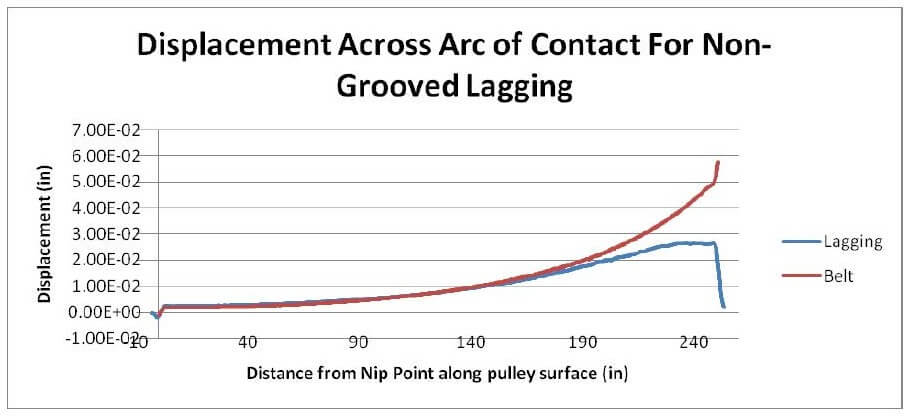
Figure 7-Belt and hysteresis displacement and position along the pulley surface.
It can be seen from Figure 7 that until the feed pinch point is about 200 inches, the difference between the hysteresis displacement and the belt cover displacement is very small. However, when we look at more than 200 inches, the lines are a bit divergent, which indicates that the belt is moving farther than the lag. This difference in displacement is slip.
Perhaps a more interesting result of this analysis is the shear strain map, which can be used to compare the hysteresis of different versions (ie grooved, non-grooved, and ceramic). Figure 8 below shows the non-groove hysteresis through the shear strain (in/in) of the contact arc.
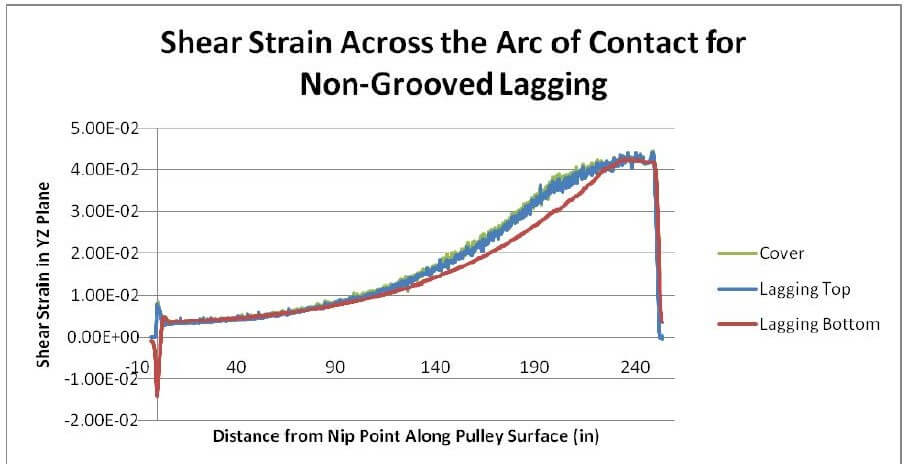
Figure 8-Shear strain and position along the pulley surface
Analyzing Figure 8, we can see that the strain gradually increases in an exponential manner until we reach the slip point (approximately 200 from the entry bite point), where the acceleration of the strain begins to decrease and reaches the maximum strain in the slip region.
The general shape of the strain map can be confirmed by the preliminary form of the strain map displayed by the improved slip prediction method described in this report, but it can also be confirmed by the stress/strain map displayed by Zeddies (1987), where the actual stress/ The strain measurement comes from a sensor placed on the surface of the pulley. Figure 9 below is an excerpt from his paper. The dotted lines on sensors 3 and 4 matches the general shape is seen in the finite element analysis (remember, for rubber, the shear strain is roughly proportional to the shear stress).
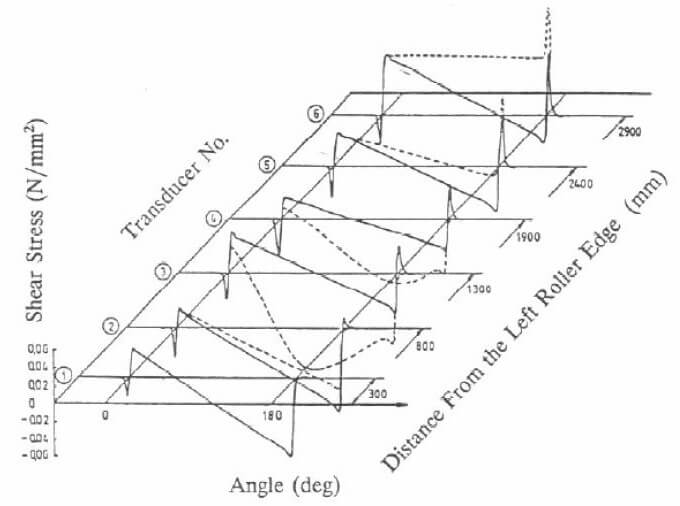
Figure 9-shows the result of slippage along the surface of the pulley by the shear stress (sensor 3 and 4)
Another phenomenon seen in the Zeddies paper and in this finite element analysis is the peak shear stress/strain at the entrance shear point (located on the left side of each figure). These spikes occur due to the movement of the rubber from below the bite point, where the normal force is high, in front of the lagging, stress-free area (Metlikovic (1997)).
When evaluating the delamination risk of a lagging design, the size of these peaks and the overall maximum strain at the bottom of the lag should be considered. The higher the strain at the bottom of the hysteresis, the greater the risk of failure. Similarly, the higher the strain on the top of the hysteresis layer, the more wear will occur in the slip zone. Obviously, the optimized hysteresis design will eliminate slip to minimize the risk of wear and minimize the stress and strain at the bottom of the hysteresis to minimize the risk of delamination.
The following Figures 10 and 11 are the shear strain diagrams for trough hysteresis design and ceramic hysteresis design.
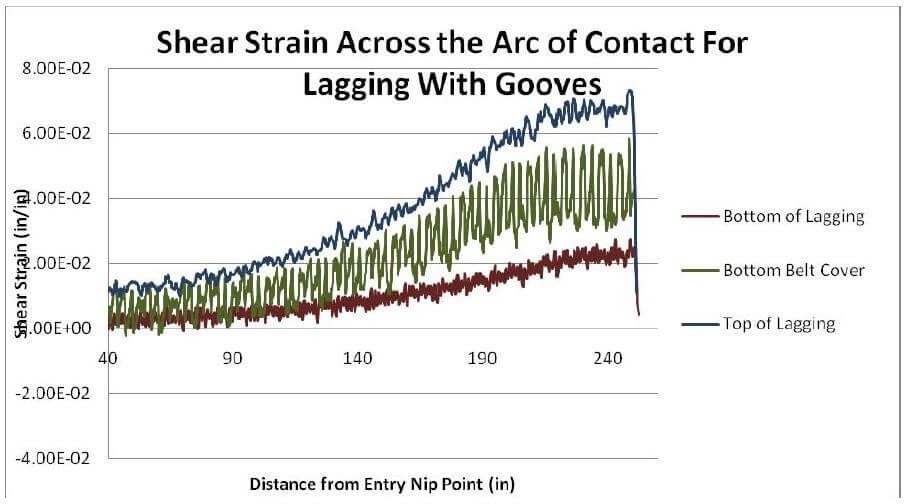
Figure 10-Shear strain vs. slot hysteresis of the different components along the contact arc in the hysteresis model.
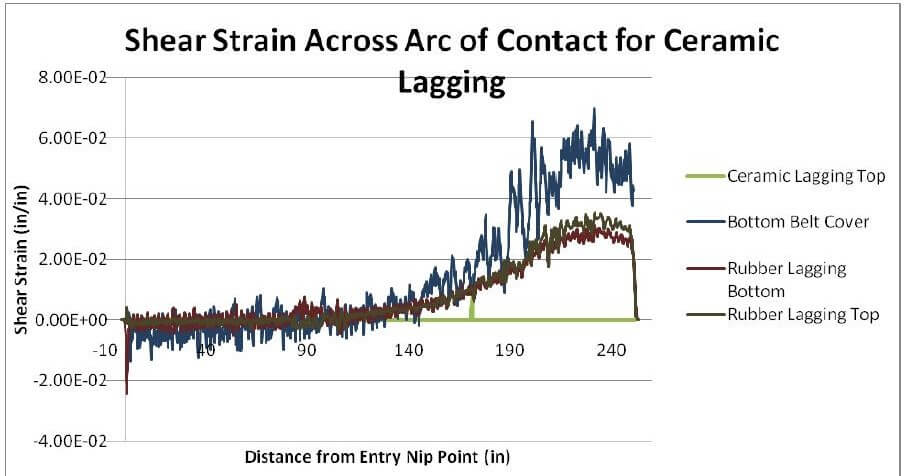
Figure 11-Shear strain and position of different components along the contact arc in the ceramic hysteresis model
Analyzing and comparing the above graphs (10 and 11) and the non-groove strain graph (Figure 9), we can start to get a picture of the effect of each hysteresis design on the variable profile. In the non-groove strain graph (Figure 9), the maximum shear strain is about 0.04 in/in. All three lines in the graph, the bottom of the hysteresis plate, the top of the hysteresis plate, and the belt cover have very similar shear in the entire contact arc. Cut strain.
Compared with the groove-type hysteresis shear strain diagram (Figure 10), the maximum shear strain is about 0.07 in/in, the hysteresis bottom strain is significantly smaller, and the strain with cover varies between the other two strain lines. We can see At this point, the increase in slotting shifts the strain from the bottom of the hysteresis to the top of the slot with the hysteresis. This makes sense because the groove allows a single rubber pad to move more and adjust the belt for its own movement.
Finally, the ceramic hysteresis shear strain map is analyzed (Figure 11). Regarding the other two hysteresis design shear strain maps, we can see that the top of the tile sees almost no shear strain due to the rigidity of the ceramic tile, while the belt cover sees The maximum strain reached is about 0.065/. The bottom of the rubber backing plate and the top of the rubber part of the ceramic backing plate have similar maximum shear strains of approximately 0.03 in/in.
This picture seems to say that it is difficult for the tile to transfer some of the lagging shear strain to the bottom belt of the belt cover while being thinner than ordinary rubber lagging to absorb the remaining part (please note that the lagging shear strain of the bottom part is 0.03 higher than that of the bottom part of the grooved rubber lagging Cut 0.02). This is derived from the fact that the hysteresis model of the strain line of the ceramic belt cover increases the highest line on the graph (compared to the grooved rubber, the hysteresis model), while the rubber hysteresis value slightly increases due to the decrease in rubber thickness as part of the ceramic hysteresis.
Further analysis of this graph may lead us to say that the ceramic hysteresis design can be improved by increasing the thickness of the rubber below the ceramic tile to allow the more shear strain to be absorbed in the bottom of the hysteresis, instead of transferring it to the bottom cover (which can be very expensive).
8. Summary
Of course, the models and methods described in this article are useful for the hysteresis optimization design of any conveyor pulley lagging application. However, with the high torque and tension of modern conveyor applications, the importance of using these analysis techniques to analyze these applications is magnified because the risk of these high torque failures and the associated costs of repairing these failures have increased. The models and analysis techniques described in this article can provide engineers with quantitative feedback on hysteresis geometry and subsequent design changes that are required to reduce local slip caused by wear and minimize the risk of hysteresis delamination.